Now live Shopify D2C only

Shopify attribution that adds up.

Numbers that reconcile to your store and your ad platforms. Period.

$79/mo — founding member rate.

First 100 members at $79/mo, locked for life. $99/mo permanent after.

  • Open attribution math — read the config, audit any number
  • Flat price at any GMV — no scaling, no contract
  • Bring your own AI — MCP endpoint, your API key (Claude at launch)
30-day money-back guarantee. If the numbers aren't more trustworthy than your current tool within 30 days, full refund.

From Brat Vukovich and the team behind Inceptly ($950M+ in D2C revenue driven) and VidTao (YouTube ad research tool used by 100K+ marketers).

~20%

Of revenue your $1,500/mo tool can't explain — labeled "Direct" or "Organic and Social."

See the breakdown
3%

Lowest unattributed bucket on a Bratrax client. Your number depends on your stack — we'll show you the math regardless.

How we do it
$0

Of your AI bill goes to us. Bring your own Claude — no token markup, no add-on tier.

Bring your own AI
01 — Why "Direct" attribution is unreliable

When your tool says "Direct," it usually means "we don't know."

Take any $5M D2C brand: 15–30% of daily revenue lands under "Direct" or "Organic and Social" — not because customers typed your URL, but because the tool gave up. UTM stripped. Referrer dropped. Session expired. Touchpoint lost to iOS.

It's not a marketing channel. It's a confession.

$1,000,000 of revenue with no idea where it came from. You can't scale it. You can't kill it. You can't defend the spend.

Exhibit A Typical $5M brand · before Bratrax
Total annual revenue:          $5,000,000
─────────────────────────────────────────
Facebook:           $2,100,000   (42%)
Google:             $1,200,000   (24%)
Email/SMS:            $700,000   (14%)
Direct (= unknown): $1,000,000   (20%)
02 — How Bratrax recovers attribution data

The order is ground truth.

Bratrax combines two layers most attribution tools don't:

  1. A first-party tracking pixel served from your own domain — so adblockers can't kill it. Captures click IDs, UTMs, and customer identifiers from the day you install.
  2. The full Shopify order record as the canonical attribution unit. When the pixel misses something — UTM stripped, iOS dropped a touch, session expired — we use what Shopify already knows about the order to fill in the gap.

We've gotten the Direct bucket as low as 3% on a Bratrax client. The case below shows another at 5% — same mechanism, different conditions. Your number depends on your stack.

Exhibit B Same brand · after Bratrax
Total annual revenue:          $5,000,000
─────────────────────────────────────────
Facebook:           $2,600,000   (52%)
Google:             $1,400,000   (28%)
Email/SMS:            $750,000   (15%)
Direct (true):        $250,000   (5%)

The order is ground truth, not the pixel. That's the part most tools skip — and it's what moves $750,000 of revenue from "we don't know" to a real source.

03 — Shopify attribution dashboards

What you see on day one.

When the math reconciles, the dashboards can do their job.

Five default dashboards, opinionated for Shopify D2C. Numbers reconcile to your store and your ad platforms — every model, every cut.

01 / Store Performance

The whole business, on one screen.

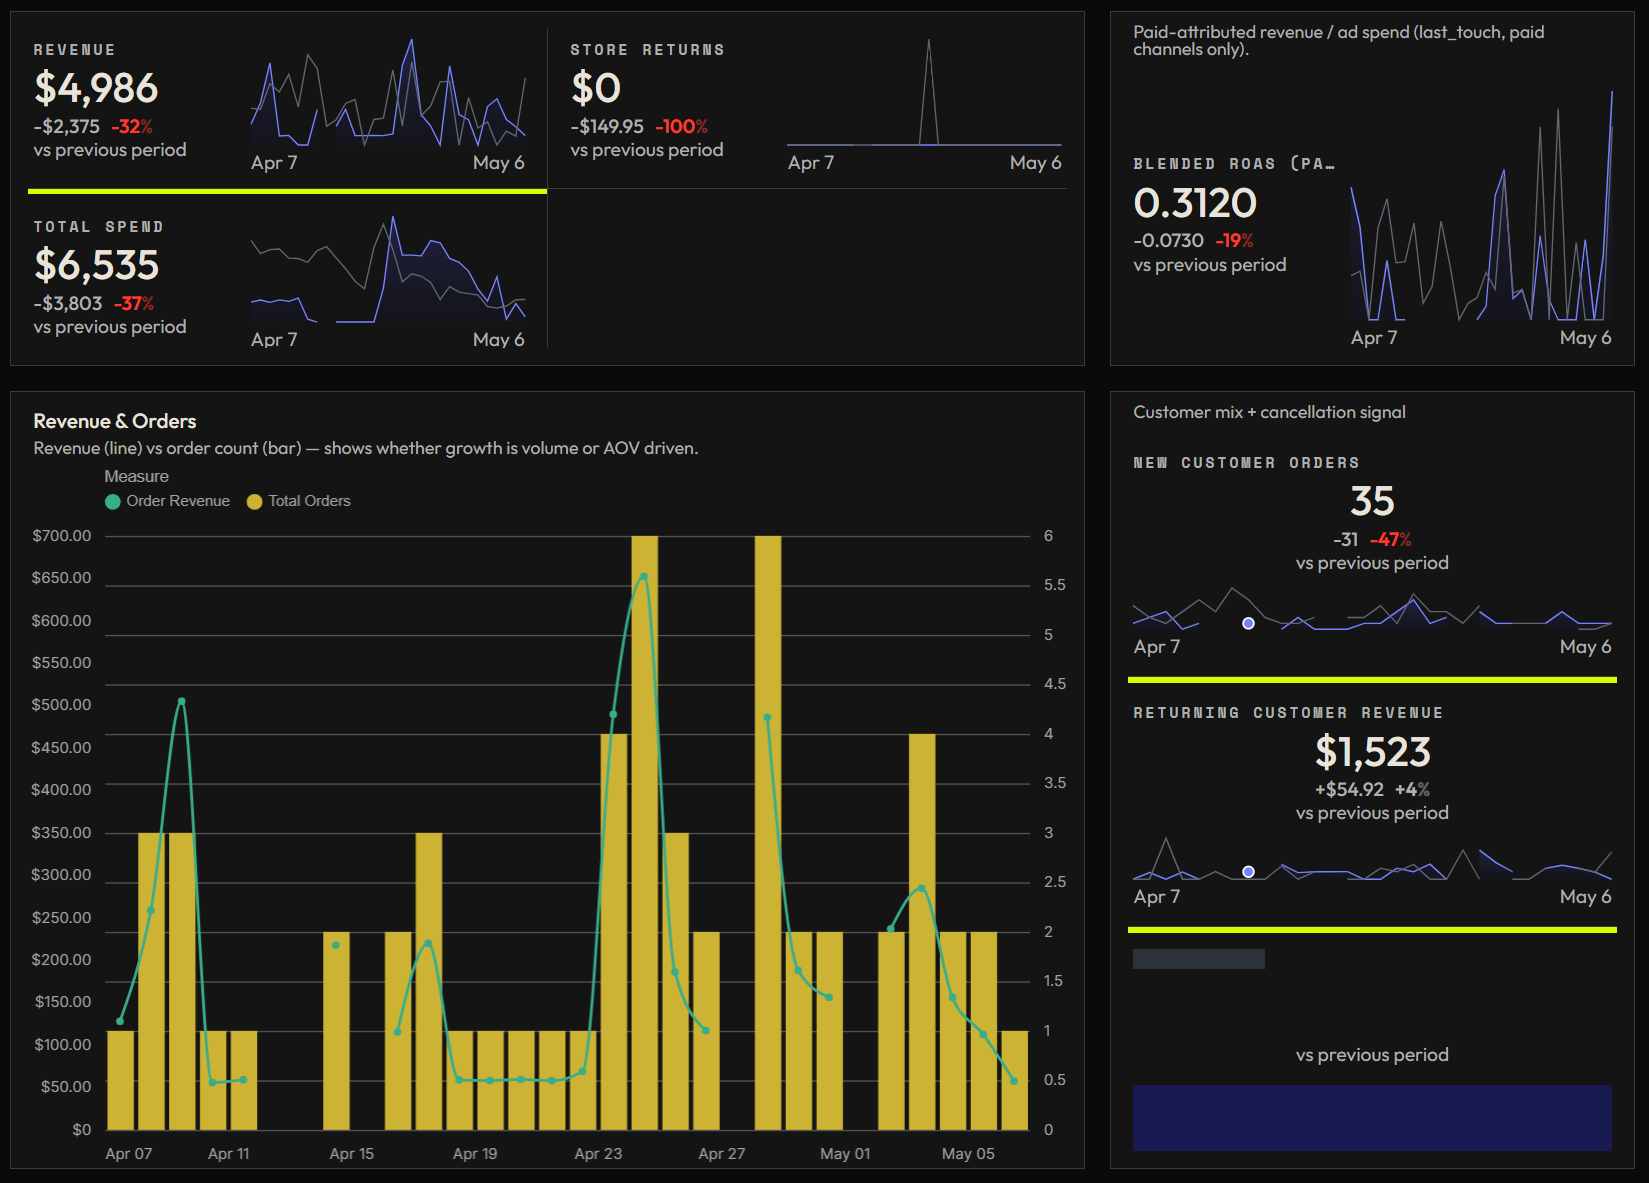
Every number a CFO would ask about, in one view. New revenue versus returning, ad spend rolled up to MER and blended ROAS, returns, subscription health.

  • KPIs Revenue, total spend, store returns, blended ROAS, MER
  • Customer mix New vs. returning revenue, order count by type
  • Subscriptions Active subs, MRR, churn rate, avg subscriber LTV
  • Trends Revenue & orders over time, MER and Blended ROAS curves
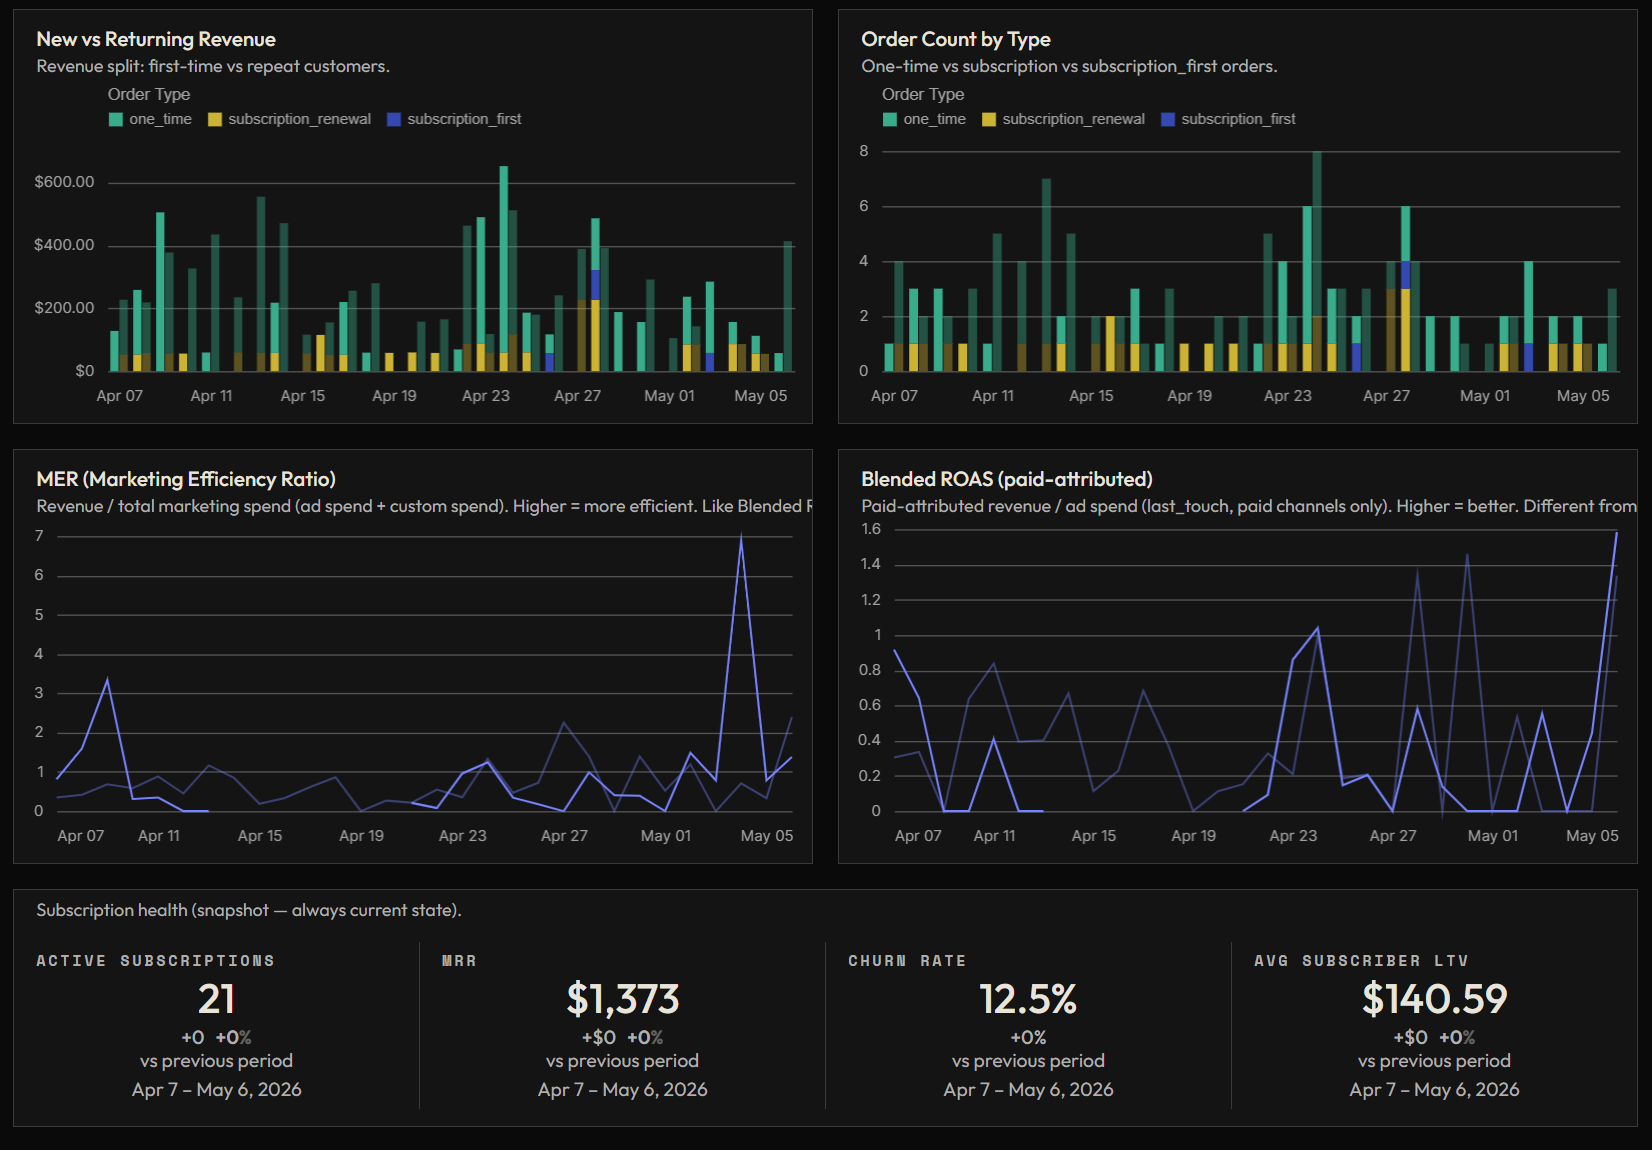
Store Performance dashboard — bottom section with trend charts for revenue, orders, and MER.
01 · bottom Store Performance
Store Performance dashboard — top section with KPI tiles for revenue, total spend, and blended ROAS.
01 · top Store Performance
02 / Attribution

Where every dollar actually came from.

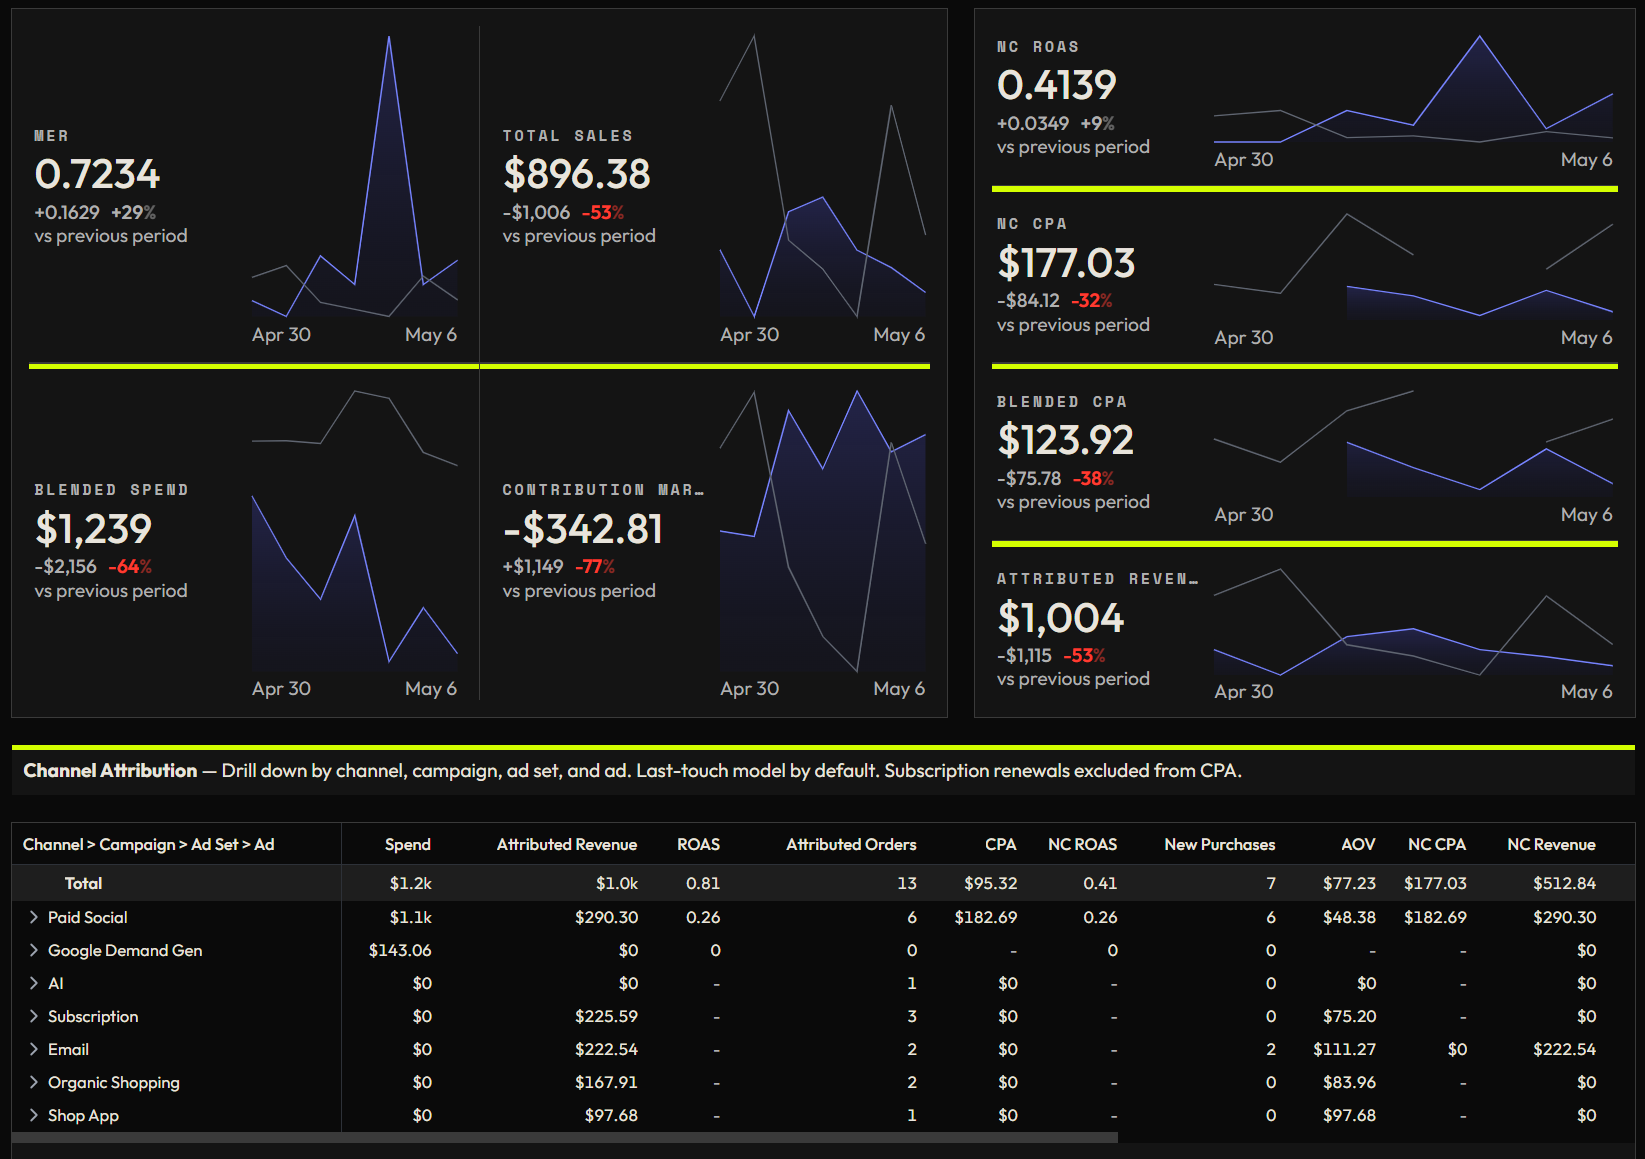
Drill from channel to campaign to ad set to ad.

  • Drilldown Channel → campaign → ad set → ad
  • Models First-touch, Last-touch, Linear, Time-decay, Position-based — switch any time, recalculated at query time
  • Efficiency MER, blended ROAS, blended CPA, contribution margin
  • New customer NC ROAS, NC CPA, attributed revenue
  • Creative health CPM and CTR over time, by channel
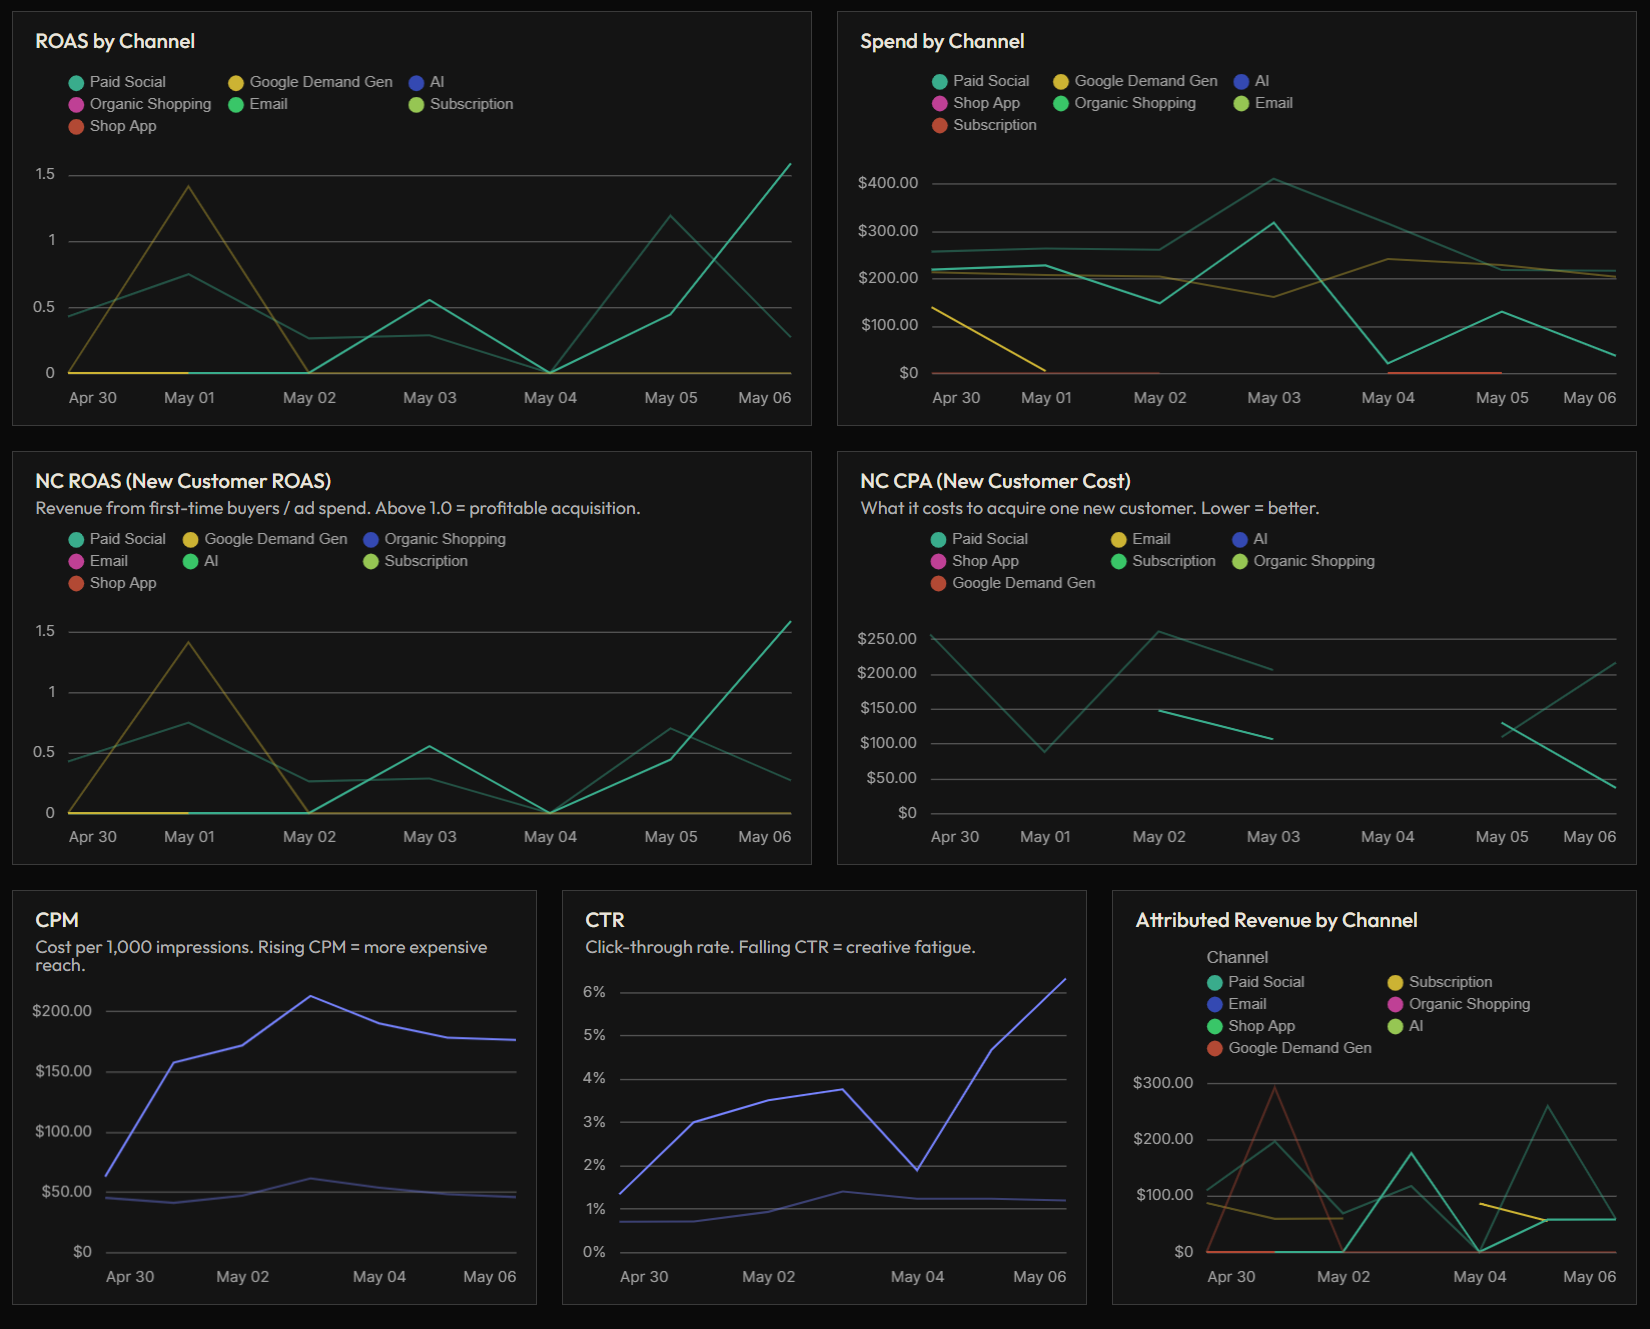
Attribution dashboard — bottom section with channel drilldown table and channel-level performance charts.
02 · bottom Attribution
Attribution dashboard — top section with KPI cards (MER, total sales, NC ROAS, blended CPA, attributed revenue) and the attribution model dropdown.
02 · top Attribution
03 / Customers

What they spend, how long they stay.

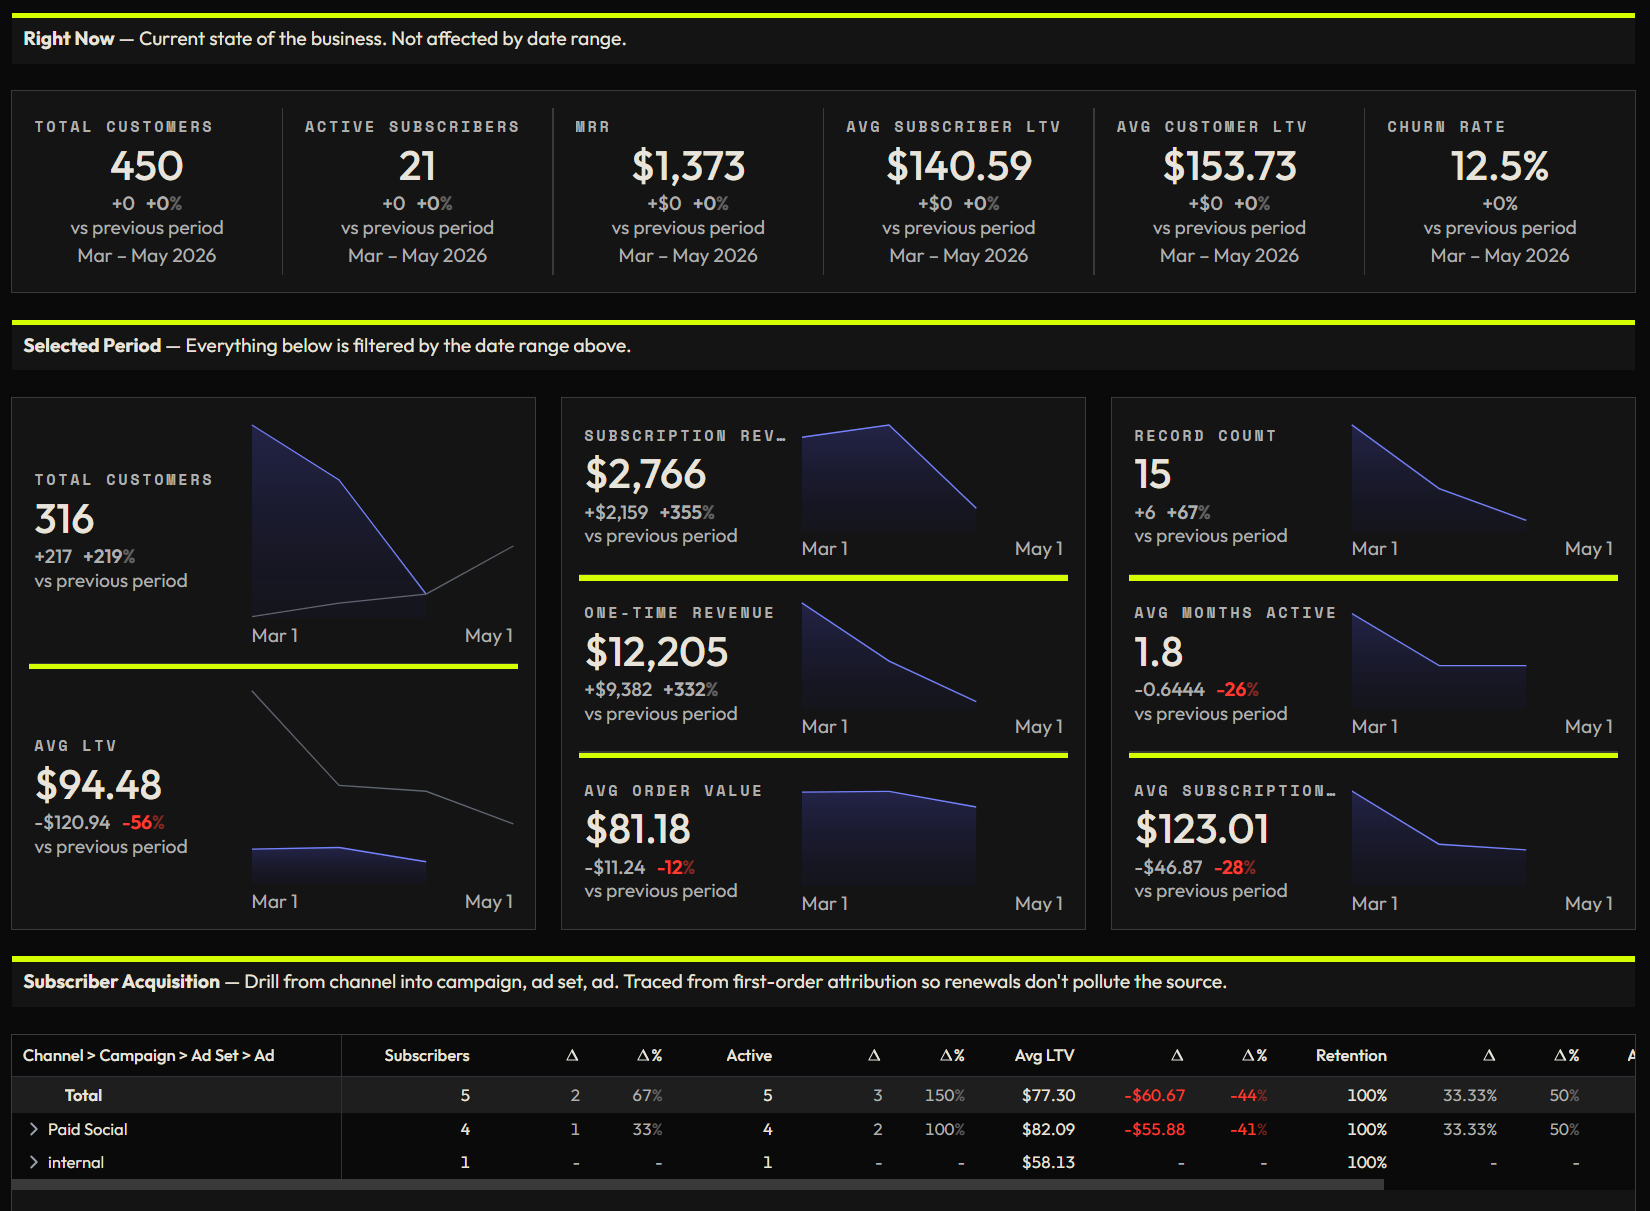
Cohort retention, LTV by segment, subscriber acquisition by channel. Right Now KPIs sit alongside selected-period trends so the snapshot and the trajectory live in the same view.

  • Right now Total customers, active subscribers, MRR, churn rate
  • LTV Customer LTV and subscriber LTV, distribution by tier
  • Cohorts Subscriber retention curves by start month
  • Acquisition Subscribers by channel — first-order attribution
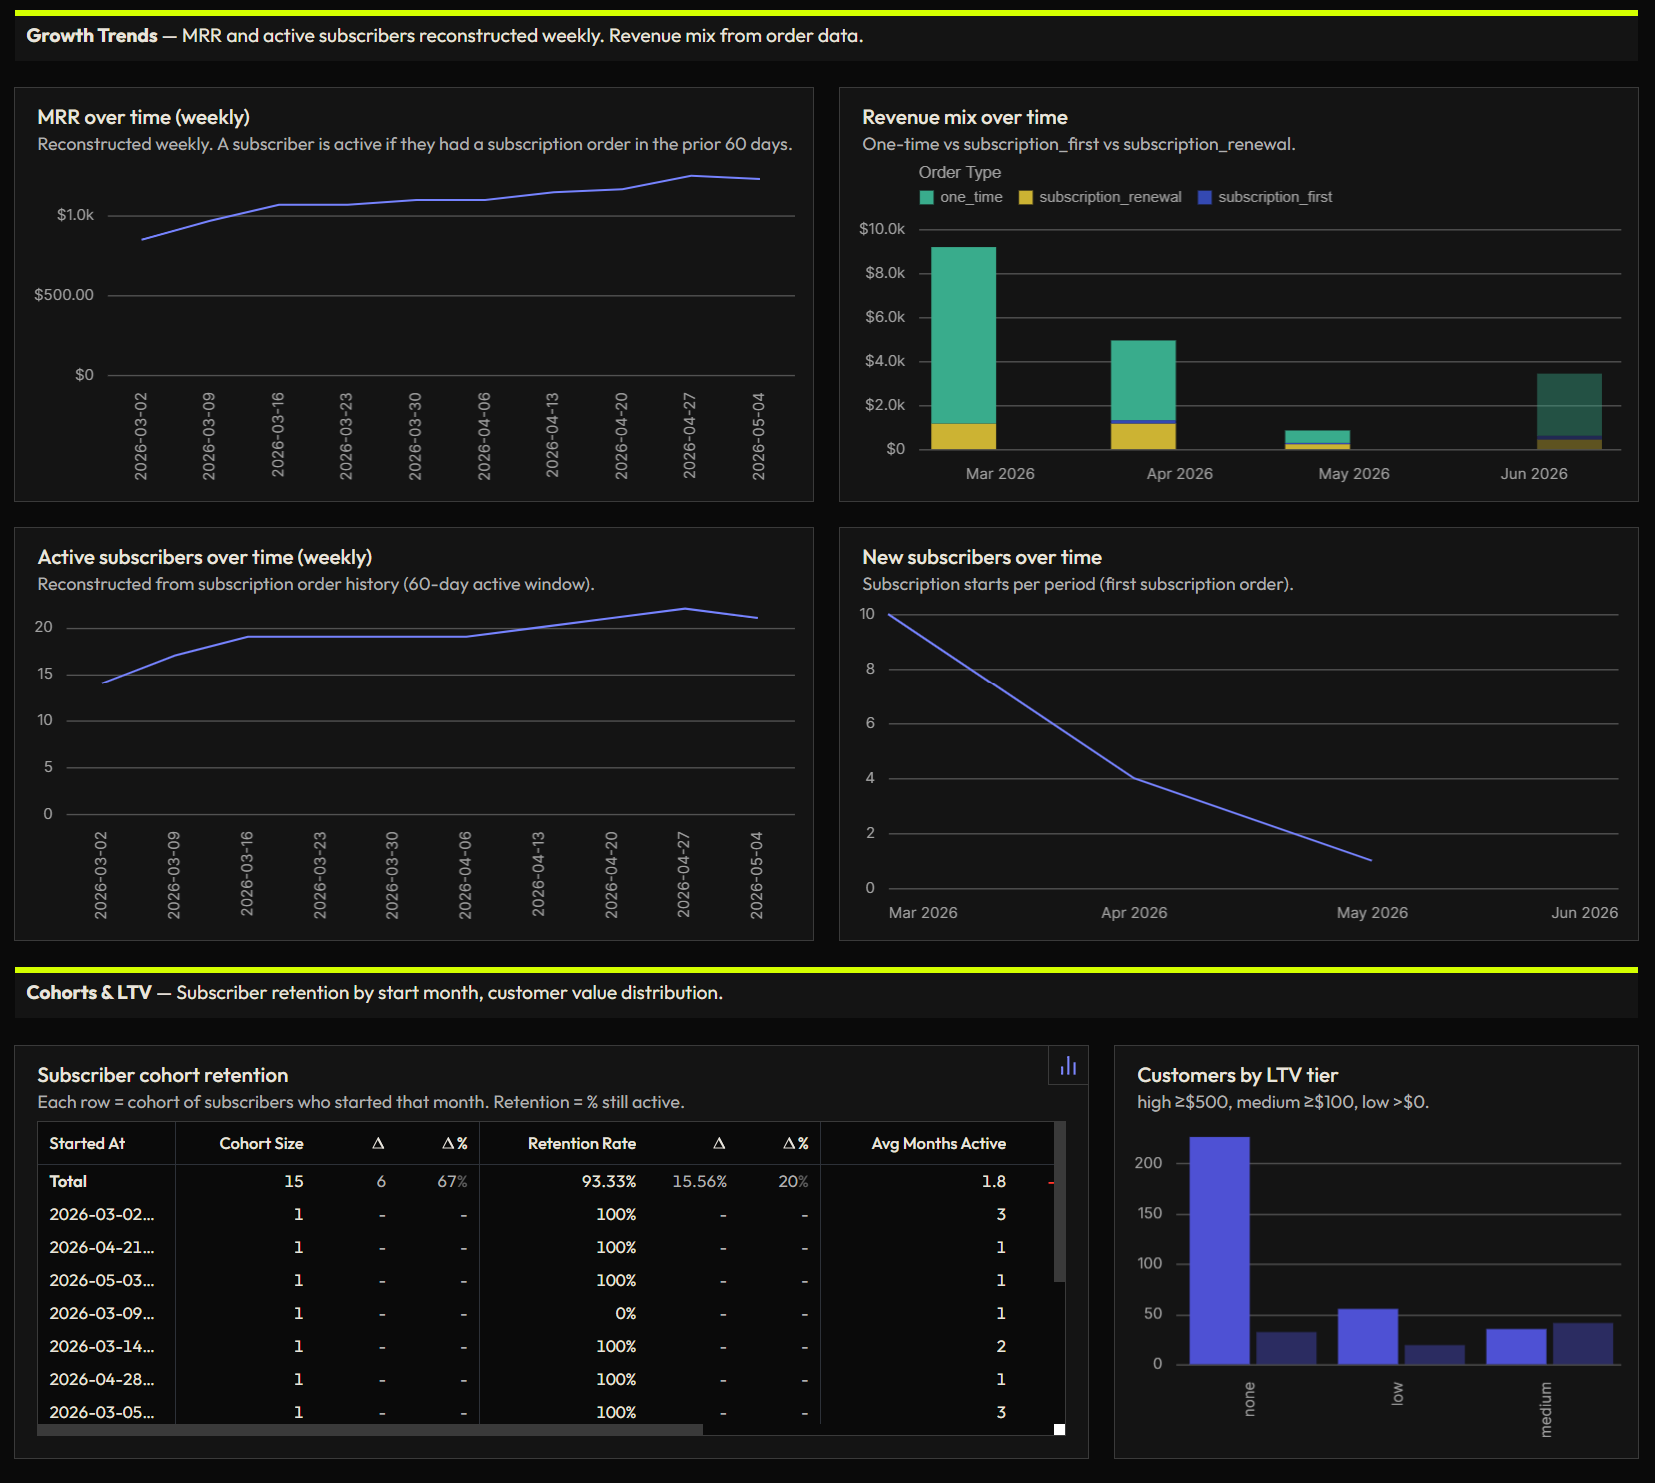
Customers dashboard — bottom section with subscriber acquisition table and cohort retention chart.
03 · bottom Customers
Customers dashboard — top section with Right Now KPIs (total customers, active subscribers, MRR, LTV, churn rate).
03 · top Customers
04 / Email & SMS

Klaviyo without the Klaviyo tab.

Campaigns and flows, sends and opens and unsubs, list health daily volumes. Deliverability decay and engagement fatigue surface before they show up in revenue.

  • Performance Sends, open rate, click rate, unsub — per campaign & flow
  • List health Sends, opens, bounces, unsubs — daily volumes
  • Lifetime Email/SMS revenue, orders, subscriber LTV, retention rate
  • Roll-ups Campaign vs. flow, period vs. previous period
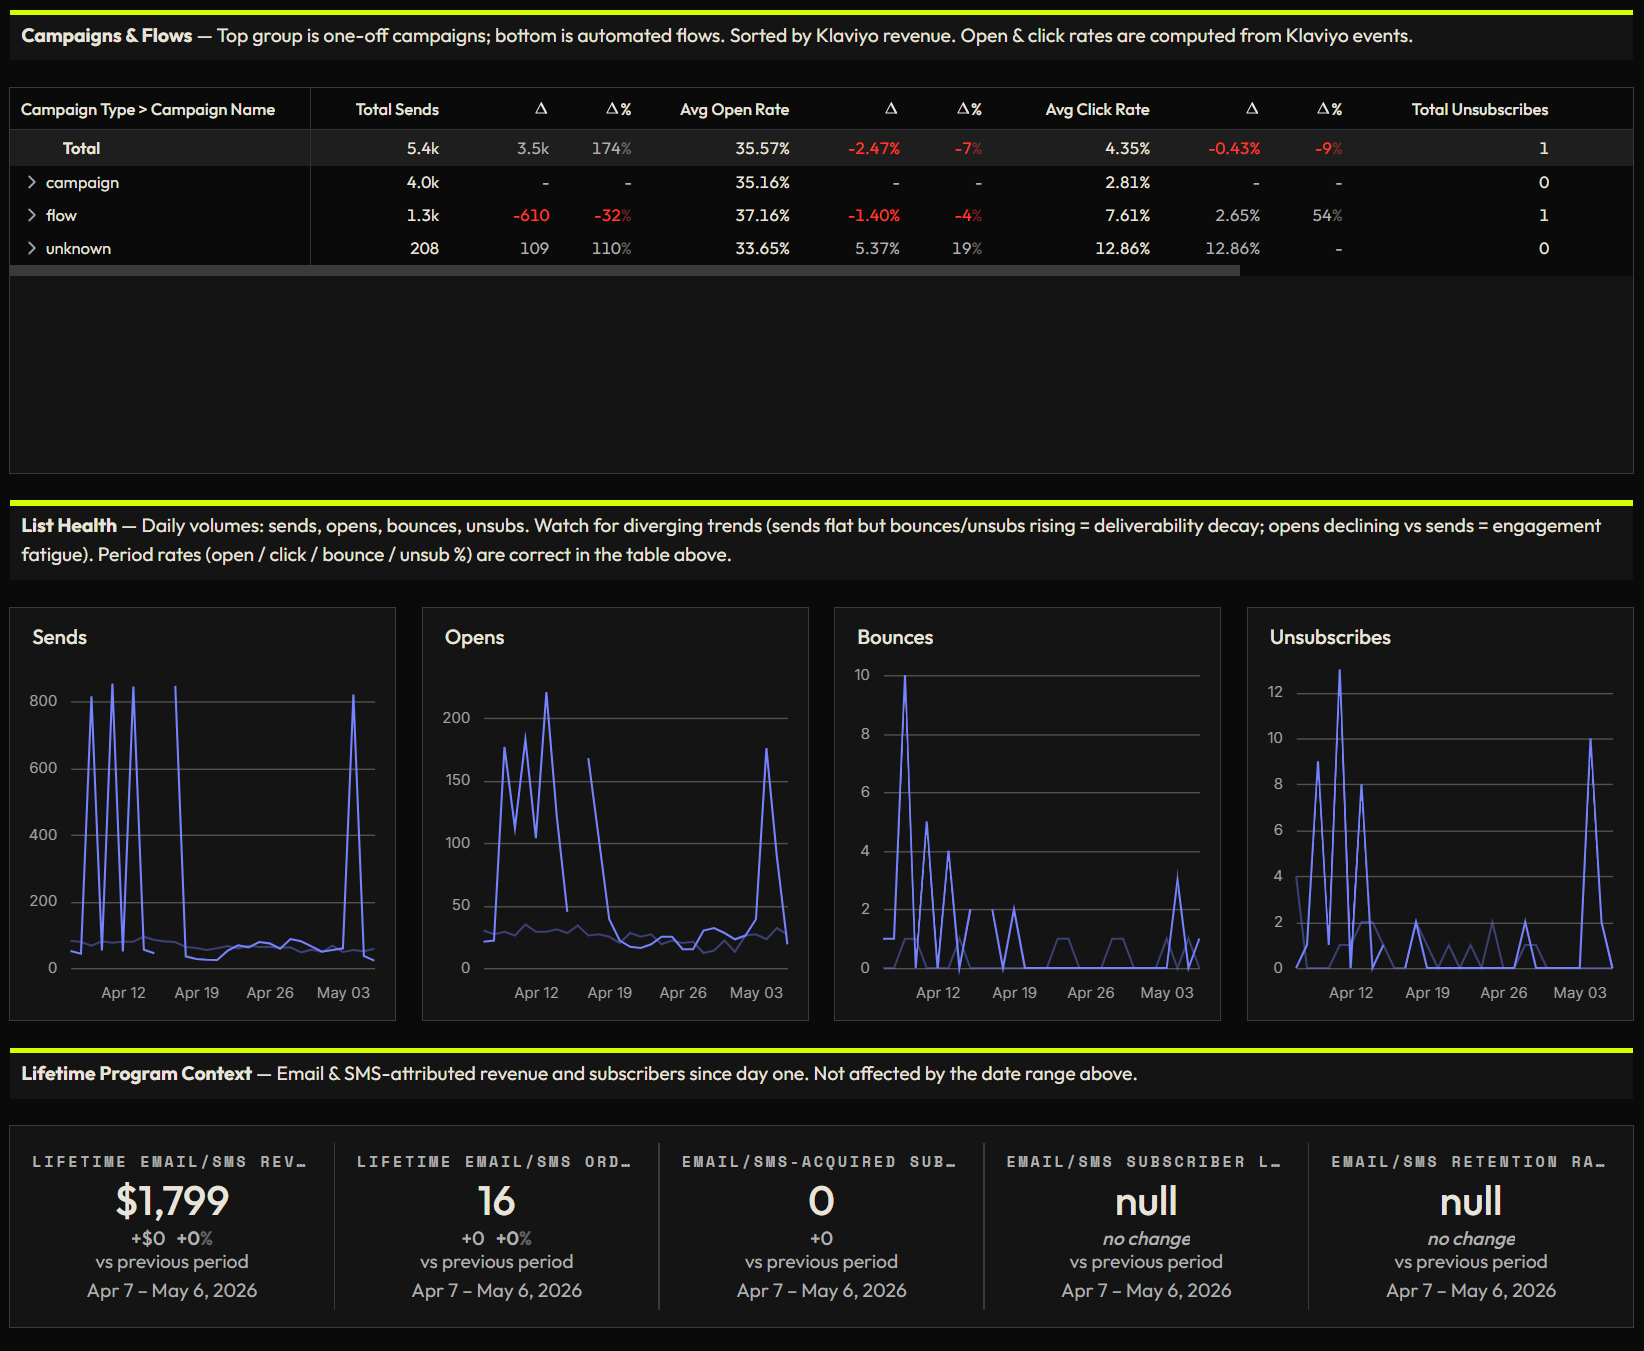
Email & SMS dashboard — Klaviyo campaigns and flows table with open/click/unsub rates, list health charts, and lifetime program KPIs.
04 Email & SMS
05 / Products

Per-SKU revenue, returns, long tail.

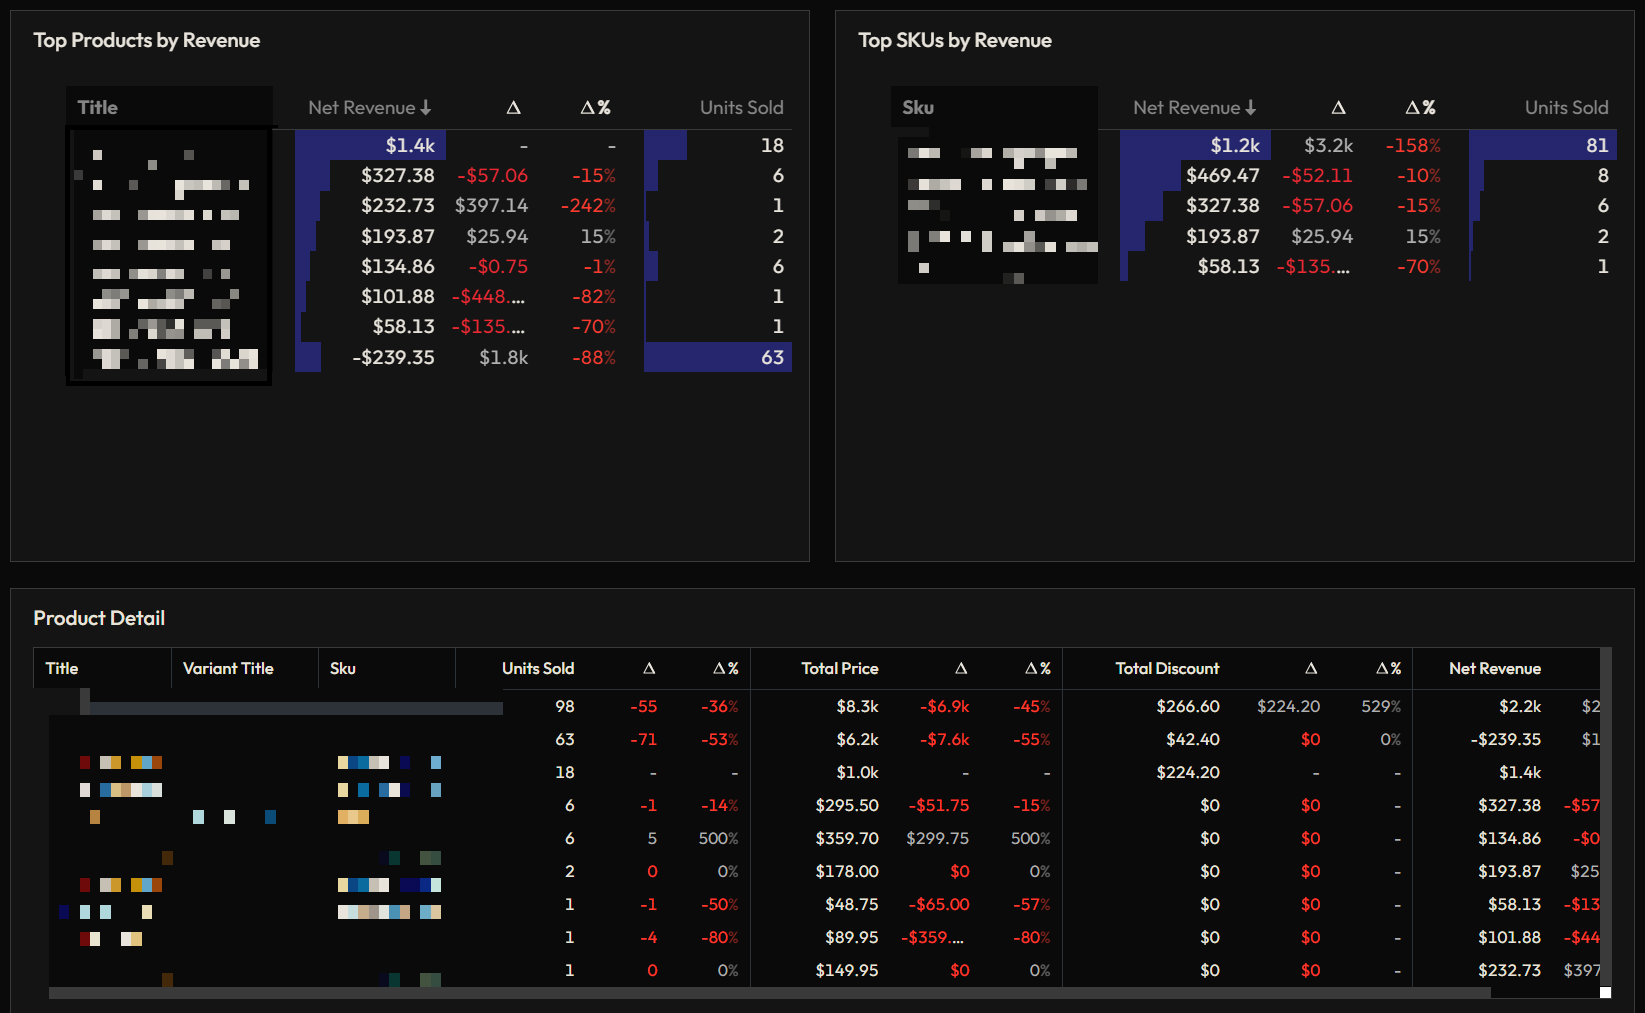
Top performers and the long tail in the same view. Net revenue, units sold, total discount per period — with per-SKU drilldown including variants.

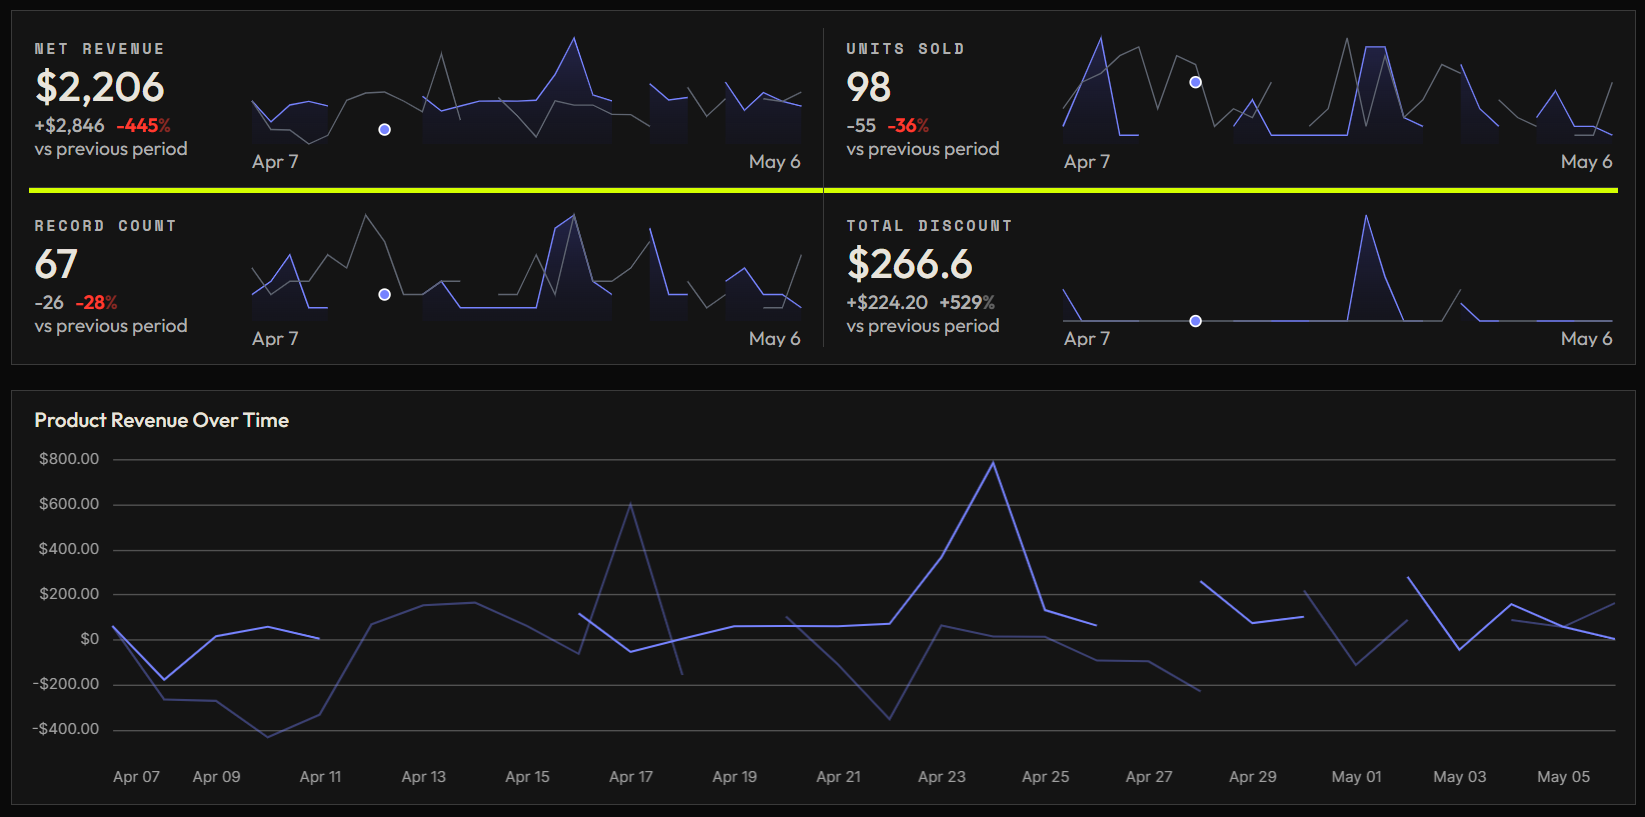
  • KPIs Net revenue, units sold, record count, total discount
  • Tops Top products by revenue, top SKUs by revenue
  • Detail Per-SKU title, variant, units, discount, net revenue
  • Trends Product revenue over time
Products dashboard — bottom section with top products and SKUs by revenue, per-SKU detail with variants.
05 · bottom Products
Products dashboard — top section with net revenue and units sold KPIs, plus product revenue trend chart.
05 · top Products
04 — Bring your own AI via MCP

Plug in your own AI.

The dashboards do the standard cuts. Your AI does the rest.

Every Bratrax account ships with an MCP endpoint — an open standard your AI uses to query your data directly. Claude works at launch with your own Anthropic key. OpenAI on the roadmap; same endpoint, no migration.

We don't ship a proprietary chatbot. We don't mark up tokens. We don't gate AI behind a tier.

The Monday-morning workflow you stop doing manually.

01 / Calculate

"Every Monday I export Triple Whale to CSV and paste it into ChatGPT to do the same calculation."

Ask Claude

"NC ROAS by source for the last 30 days. Allocate spend by NC order share, not total."

Hover for Claude's answer →
Claude · using your Bratrax data
ChannelNC SpendNC ROAS
Meta$45,5800.29×
Google Ads$20,0300.27×
Email

Both paid channels underwater on NC acquisition. ~$3.50 spent per $1 of new customer revenue. Investigate before scaling.

02 / Diagnose

"My ROAS dropped 30% last week and the dashboard doesn't tell me why."

Ask Claude

"Why did my blended ROAS drop last week?"

Hover for Claude's answer →
Claude · using your Bratrax data

Blended ROAS dropped ~0.75× (Feb) → ~0.49× (late April). You turned off a Meta campaign at $2.71 CPC and replaced it with new ones at $4.25–$5.49 CPC — nearly double per click. Orders fell 40% on similar spend.

The new campaigns aren't paying off. CPA jumped from ~$110 to ~$160. Reactivate or replace before scaling further.

03 / Pinpoint

"My CMO asks 'where's the leak?' and I dig through five tabs to answer."

Ask Claude

"Funnel dropoff by step, last 7 days."

Hover for Claude's answer →
Claude · using your Bratrax data

3,310 sessions → 1,860 PDP (56%) → 240 ATC (12.9%) → 270 purchased. Overall conversion: 8.16%.

Biggest leak: PDP → Add to Cart (87% dropoff). Bonus catch: checkout_started events firing inconsistently — fix the pixel before trusting the funnel.

These are calculations operators currently do manually — by stitching together CSV exports, dashboard screenshots, and running a series of carefully worded prompts.

With Bratrax, each is one question to your AI.

You provide the API key. We provide the data. Your relationship with your AI provider is yours.

Done paying $1,500/mo for data you still don't trust?

First 100 founding members get $79/month, locked in for life.

Start now

30-day money-back guarantee. Cancel from settings in one click.

05 — Bratrax vs Triple Whale, Hyros, Northbeam

The math.

Bratrax Lite Triple Whale Compare → Hyros Compare → Northbeam
Starting price $79/mo flat $179/mo $230–$459+/mo $1,000+/mo
Price at $5M GMV $79/mo $1,129/mo $999+/mo $2,500+/mo
Pricing model Flat, life-locked GMV-scaled Tracked-rev tiered Custom
Setup time ~9 minutes Days Weeks Weeks (3-mo prepay)
AI access Your AI via MCP (Claude at launch) Moby None None
Data portability Full warehouse + export Limited No No
Money-back guarantee 30 days No No No
Contract None Annual Annual Annual + 3-mo prepay
At $5M GMV, Triple Whale charges $1,129/month. Bratrax Lite is $79. That's $12,600 per year back in your pocket — same math, less ceremony.
06 — How to set up Bratrax Lite

Live in under 10 minutes.

01

Connect Shopify.

One click. Full historical backfill from day one — every order, customer, and SKU since you opened the store. No six-week wait for data.

02

Link Meta, Google, Klaviyo.

OAuth across the board. Shopify handles tracking automatically; off-Shopify pages get a guided snippet.

03

See what's working.

Five pre-built dashboards — every cut a CFO would ask about. Five attribution models, switch between them any time.

04

Plug in Claude.

Install the MCP endpoint with your own Anthropic API key. OpenAI on roadmap. Same endpoint, no migration.

Most brands go from signup to live dashboard in under 10 minutes.

07 — Bratrax pricing and plans

Choose your level.

Bratrax Clear Vision
$5,000/mo
For brands that need a dedicated analyst
  • Everything in Lite
  • Custom data model built around your business
  • Custom dashboards and attribution models
  • Dedicated human analyst on your data weekly
  • AI analyst with write access to your data model
  • Slack access to the data team
  • Weekly strategic reviews
  • For brands spending $200K+/mo on ads
Apply for Clear Vision

Most brands start with Lite. You discover Clear Vision by outgrowing Lite, not by reading a feature comparison.

08 — Who Bratrax Lite is for

Built for Shopify D2C. Not for everyone.

A fit if
  • You run a Shopify D2C brand doing $500K–$20M annually.
  • You spend on Meta, Google, or both and you're tired of three dashboards disagreeing every Monday.
  • You already use Claude (or are open to it) and want it on your business data.
  • You've tried other attribution tools and got more dashboards instead of more clarity.
Not a fit (yet)
  • Not on Shopify. Other commerce platforms are on the roadmap.
  • Agency call funnels or affiliate VSLs. Lite is D2C-specific.
  • Running multiple separately-owned stores. Single-store at launch.
  • Want managed ads or a human strategist. Lite is the tool. Clear Vision is the service.
09 — About Bratrax founder Brat Vukovich
Brat Vukovich, Founder of Bratrax Photo
Brat Vukovich
Founder portrait

Brat Vukovich — Founder, Bratrax — @bratinceptly

Why I built this.

Every D2C engagement at Inceptly starts the same way. The team has an attribution tool. Dashboards. Data. They still don't trust the numbers enough to make a real budget decision without pulling up a spreadsheet first.

They're paying $300, $500, sometimes $1,500 a month. And the routine is still: check the tool, check Shopify, check the ad platform, compare, go with gut.

The biggest reason they don't trust the numbers: roughly a fifth of their revenue is sitting in a "Direct" or "Organic and Social" bucket the tool can't explain. So we engineered around it. We've gotten the bucket as low as 3% on a Bratrax client. The mechanism works. We'll show you the math regardless of where your number lands.

One thing I'll say upfront: Bratrax won't tell you why a customer bought. No tool can. What we show you is what they actually did on your site before they bought — every session, every source, every touch we can recover. That's correlation, presented honestly. Bratrax gives you the picture. You bring the judgment.

I won't ship a tool whose numbers I can't defend to a CFO. Before launch, I tested Bratrax against live client data for weeks — numbers match Shopify, numbers match the ad platforms. That's the foundation. Everything else is built on top of that — the dashboards, the AI integration, the price.

We don't have a sales team. We don't have investors telling us to charge more. We have engineers, and we have opinions about how analytics should work.

That's the whole pitch.

— Brat

10 — Shopify attribution FAQ

Common questions.

Same attribution methodology, none of the sales-team overhead. Flat $79/mo regardless of GMV. No contract, no demo. We give you an MCP endpoint so your data connects to the AI you already pay for. The incumbents don't.

Depends on your stack. The mechanism: a first-party tracking pixel served from your own domain, plus the Shopify order record as ground truth — when the pixel misses something, the order itself usually has enough context to recover the source. We've gotten it to 3% on a Bratrax client. Another landed at 5%. We won't promise a number because the result depends on conditions we don't control.

Claude at launch — install the MCP endpoint with your own Anthropic API key. OpenAI on roadmap. Same endpoint, no migration. If you don't use Claude, the dashboards still stand alone.

Active accounts refresh every hour. Idle accounts refresh every two hours.

No. No tool can. Attribution is correlation, not causation — Bratrax won't tell you why a customer bought, but it will show you what they actually did on your site: every session, every source, every touch we can recover. The picture is honest. The judgment is yours.

30-day money-back guarantee. Full refund, no questions, cancel from settings in one click.

Lite is self-serve SaaS at $79/mo. Clear Vision is a service at $5K/mo with a dedicated analyst, custom data model, and weekly reviews. Most brands start with Lite.

Read the full FAQ →

First 100 founding members. $79/month, locked in for life.

Start now — $79/mo

No sales calls. No contracts. 30-day money-back guarantee.